
Unreal Engine tools that solve challenges
Unreal Engine performance optimization refers to the process of fine-turning games built on the Unreal Engine to achieve optimal performance across various hardware configurations.
Image Resolution
Unreal Engine tools excel at addressing challenges related to image resolution. They offer advanced techniques for handling texture compression, mipmapping, and LOD systems. These tools empower developers to strike a balance between visual fidelity and performance, enabling games to run smoothly on a range of hardware configurations.
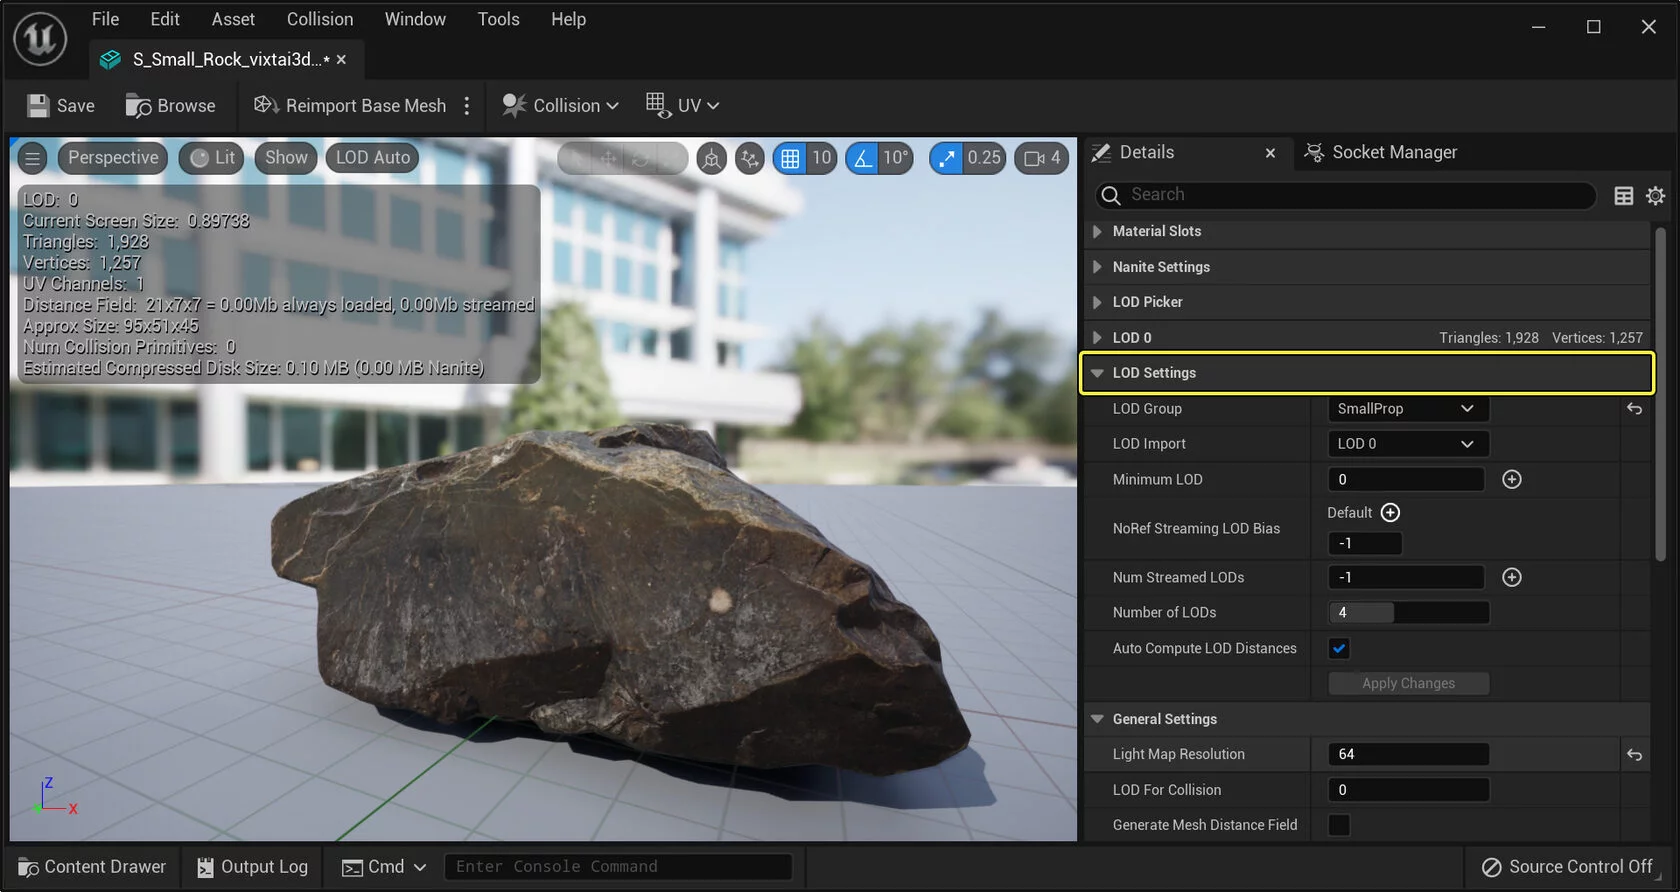
Levels of Detail
LODs are essential for managing the complexity of 3D models and optimizing performance. Unreal Engine provides robust LOD creation tools, allowing developers to generate simplified versions of assets at different distances. This ensures that high-polygon models are replaced with low-polygon versions when viewed from a distance, reducing the strain on system resources without sacrificing visual quality.
Proxy Geometry Tool
The Proxy Geometry tool is invaluable for optimizing scenes with large amounts of detailed geometry. It allows developers to replace high-polygon assets with simplified versions, reducing memory usage and improving rendering performance. This tool is particularly useful for open-world environments or games with vast landscapes.
Lighting and Shadowing
Lighting and shadowing play a pivotal role in creating immersive environments. Unreal Engine provides a host of tools to optimize lighting and shadowing effects, such as dynamic shadow resolution adjustment, precomputed lighting, and efficient light-backing solutions. These tools ensure that games maintain visual quality while maximizing performance.
Miscellaneous Effects
Unreal Engine also caters to optimizing various miscellaneous effects that enhance the game’s aesthetics. Tools are available for optimizing particle systems, post-processing effects, and material shaders, enabling developers to strike the perfect balance between visual impact and performance efficiency.
Unreal Engine Game Optimization Techniques
When it comes to your Unreal Engine game, blind optimization should be avoided. Identifying the bottleneck in your project is essential to achieve meaningful performance gains effectively. With the Game Thread, Render Thread, and GPU operating asynchronously, understanding which component is causing performance limitations is crucial.
Finding the Bottleneck
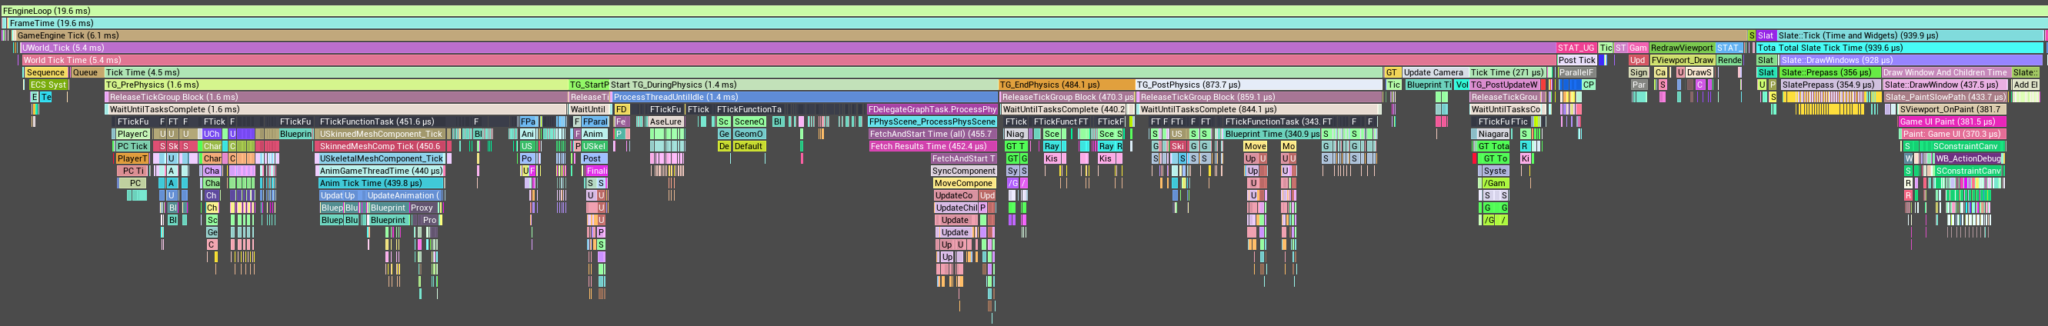
Measuring and identifying the bottleneck is a crucial first step. Unreal Engine provides tools to assist in this task. Unreal Insights, a flagship profiling tool, offers detailed insights into various aspects of your game’s performance, including CPU, GPU, memory, file loading, and threading. By using commands like “stat unitgraph” and “stat detailed”, you can gather valuable information to identify the performance bottleneck.
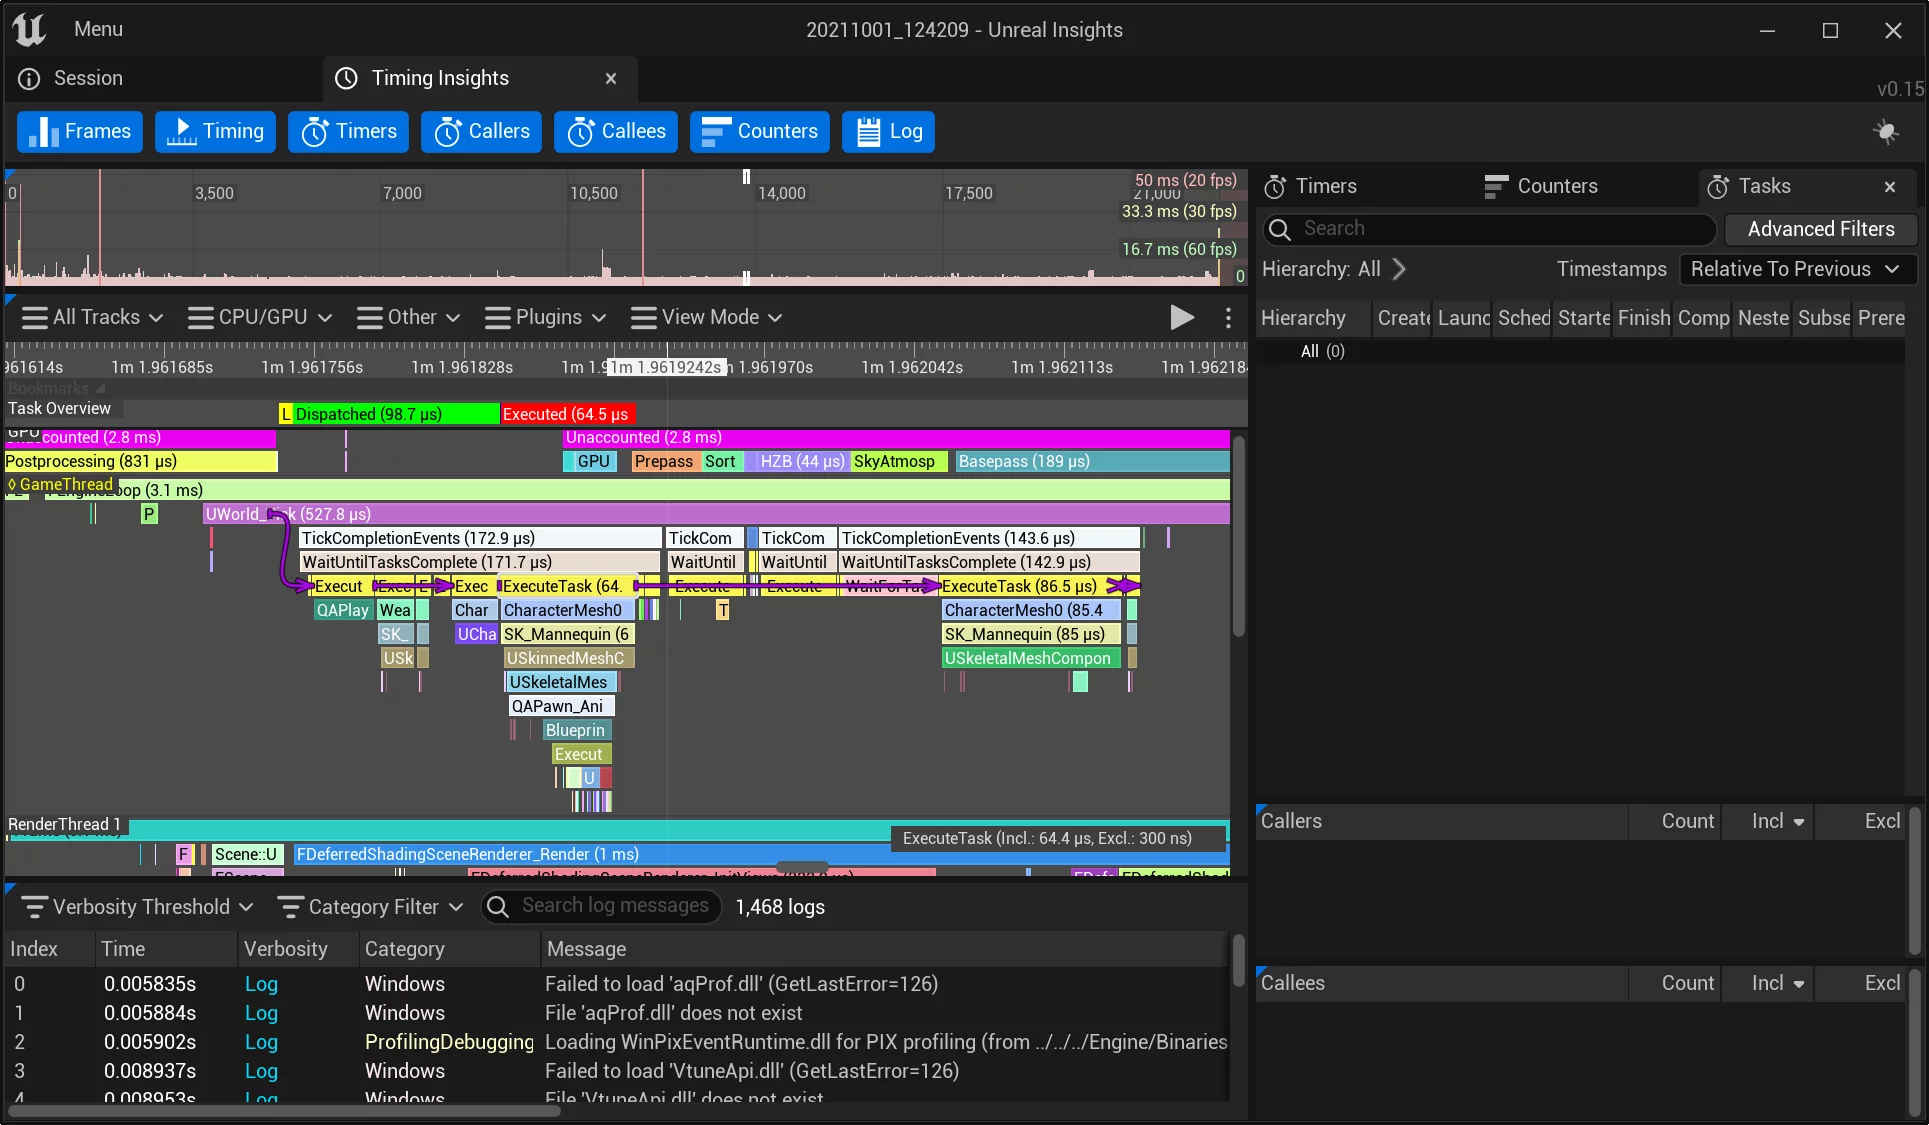
Unreal Insights
Unreal Insights is a powerful profiling tool available in Unreal Engine 4 and continuously improving in version 5.0. It provides advanced memory profiling and offers detailed insights into frame timings, CPU/GPU usage, memory consumption, file loading, and threading. This tool allows you to drill down into specific frames or sessions, enabling deep analysis of performance bottlenecks.
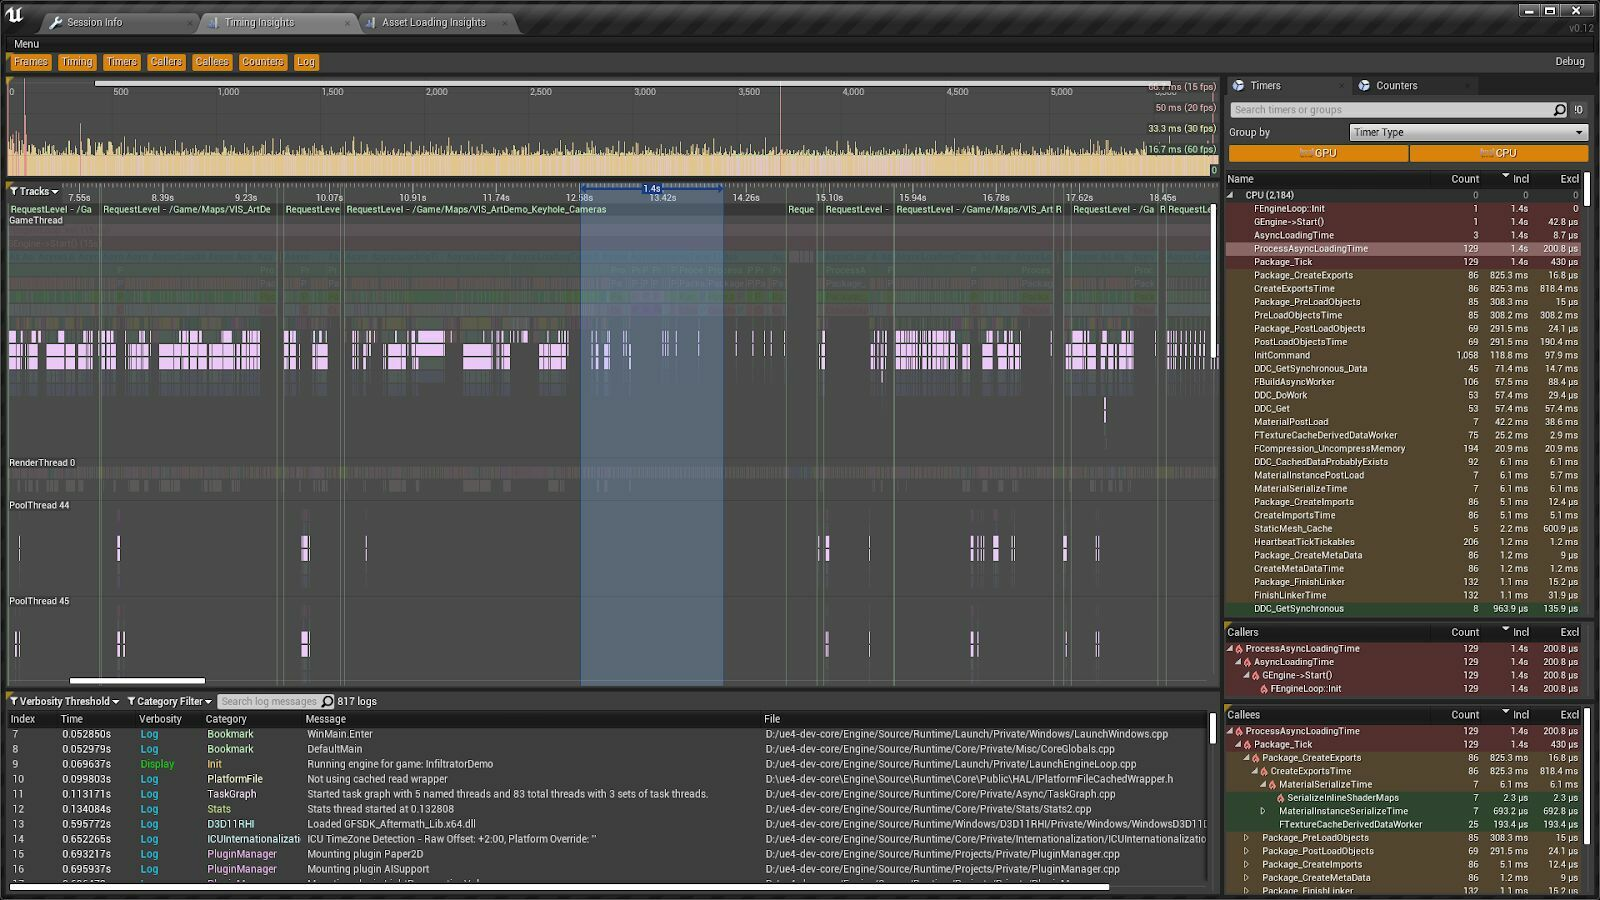
Optimizing Memory & Loading
Unreal Insights provides various commands and features to assist in memory analysis, such as “memreport -full” and “loadtimes.dumpreport”. These tools provide detailed reports on memory usage and loading times, helping you identify areas for optimization and improving overall performance.
Culling
Culling is a vital technique for optimizing scene rendering. Unreal Engine offers powerful culling tools that determine which objects and assets are visible to the camera and dynamically cull out those that are not. This reduces unnecessary rendering calculations, leading to improved performance and frame rates.
Defeaturing
Defeaturing is an optimization technique that simplifies complex geometry geometry by removing unnecessary details that may not impact gameplay significantly. Unreal Engine provides tools to automatically defeaturing geometry, reducing the computational load and improving performance without compromising visual fidelity.
Utilizing Unreal Insights Tips
To maximize the effectiveness of Unreal Insights, consider the following tips:
- Run commands during a session to compare performance, such as using “r.ScreenPercentage 20” to reduce rendering resolution or “Pause” to freeze the Game Thread.
- Customize the profiling categories to focus on the most relevant aspects of your optimization goals, reducing unnecessary overhead.
- Utilize custom bookmarks in Unreal Insights to mark specific gameplay contexts and easily revisit them for analysis and comparison.
[ Content Source: https://www.argentics.io/unreal-engine-game-optimization ]
Unreal Engine Game Optimization on a Budget
Profiling Preparations
Before you can start profiling make sure you are set up. Here is a brief checklist of things to keep in mind when profiling. Disabling vsync and other framerate features. Having unbaked lights can drastically influence performance and muddy your results while profiling as slower render paths are used.
Ideally, when profiling with tools such as Unreal Insights you package your game rather than running from within the editor. Besides getting very different memory usage and more stuttery level streaming, your frame timings may be quite different in an editor build as well. Running the game in ‘Standalone’ is still very convenient, make sure your Editor viewport has ‘Realtime’ disabled and is minimized.
- r.vsync 0
- t.maxfps 0
- SmoothFrameRate = false (Project Settings)
- Lighting Built & MapCheck Errors resolved
- Packaged Game build
- Editor ‘Standalone’ is convenient (memory and timings may be (very) off)
Find the Bottleneck
You should not be blindly optimizing code in your project. Instead, make sure you measure and find your bottleneck. With Game, Render, and GPU all running asynchronously from each other, it’s important to know which is your bottleneck or you are not going to see any meaningful performance gains.
- Game Thread / Render Thread / GPU
- Unreal Insights
- ProfileGPU + r.RHISetGPUCaptureOptions 1
stat unitgraphstat detailedr.screenpercentage 20pause(Freeze Game Thread)
- Memory & Loading
- Unreal Insights (-trace = memory, loadtime, file)
memreport -fullloadtimes.dumpreport
Unreal Insights
Unreal Insights is the new flagship profiling tool that came in late Unreal Engine 4 and is still seeing major improvements in 5.0 with more advanced Memory profiling for example.
- Detailed Insights into the frame timings:
- CPU/GPU
- Memory
- File Loading
- Threading
- Drill down on a single frame or session
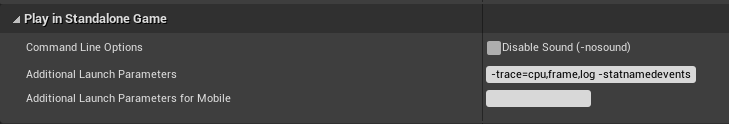
Trace Channels
Some common trace channels to use on your game executable or in Standalone. statnamedevents argument provides more detailed information on object names.
-trace=log,cpu,gpu,frame,bookmark,loadtime,file,memory,net-statnamedevents- Full list of Trace Channels
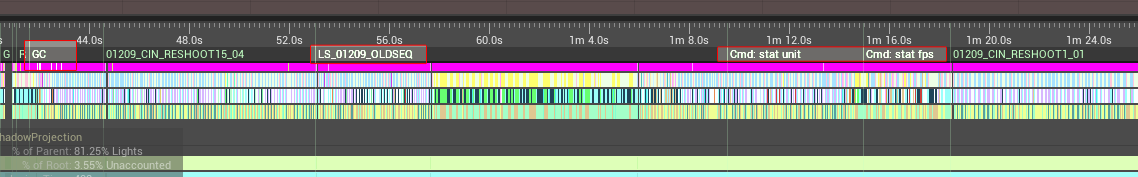
Bookmarks
Bookmarks add contextual information about changes and transitions that happens during the profiling session. This includes streaming in new levels, executing console commands, starting a cinematic sequence, etc. You can easily add new bookmarks to your own game code to add more context. While profiling using bookmark trace channel.
- Bookmarks for context and transitions
- GC (Garbage Collection)
- Sequencer Start
- Level streaming (Start / Complete)
- Console Commands
TRACE_BOOKMARK(Format, Args)
Add new ‘stat’ profiling
For your C++ game code, it can be valuable to include additional profiling details by adding your own stat tracing. By default, your blueprint functions will only show up as ‘Blueprint Time’, adding custom profiling will add more details on where this time is spent if that Blueprint called into your C++ game code. This is relatively straightforward to do.
- Add profiling detail to your game code
- Track as “stat YourCategory” in the viewport or via insights.
Unreal Insight Tips
It may prove valuable to run some commands during a profiling session to see how this affects your frame in great detail. Especially as some features are first processed on the Game Thread, and may then get handled by the Render Thread later that frame such as Skeletal Meshes.
- Run commands to compare during the session (Shows as Bookmark)
- r.ScreenPercentage 20
- pause
- Use only necessary TraceChannels for lower overhead
- Add custom Bookmarks for gameplay context
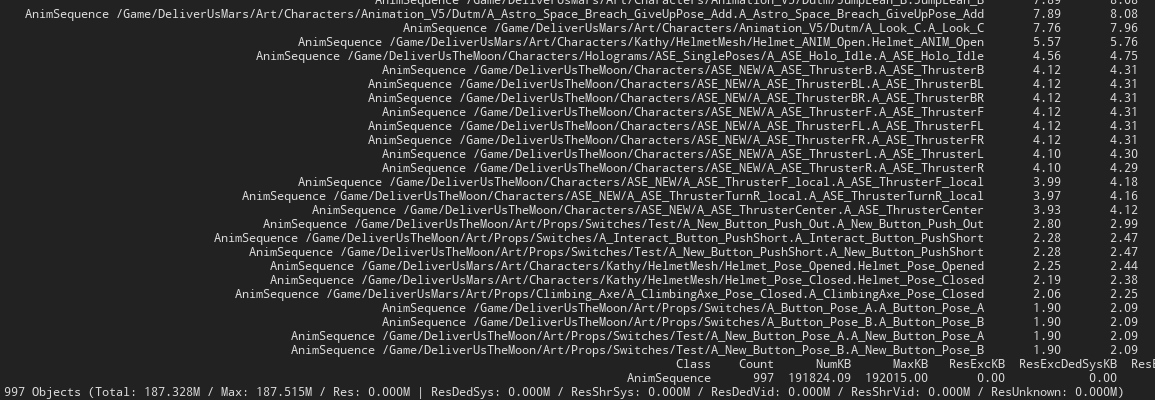
Memreport -full
memreport -full provides a great insight into your memory usage and whether assets are loaded unintentionally. Drilling down into a specific asset type with obj list class= will provide further details on the most expensive assets.
memreport -full- Runs a number of individual commands for memory profiling
obj list class=- Example:
obj list class=AnimSequence
- Example:
- Only in Packaged Builds for accurate results
- Example:
AnimSequenceis twice as large in editor builds
- Example:
DumpTicks
DumpTicks is a great first step to optimizing Game Thread performance. Dump all ticking objects to review what should be ticking or whether they can be disabled.
dumpticks/dumpticks grouped- Outputs all Actor and Component Ticks
listtimers- Run on low frequency
- avoid heavy load (stuttering)
stat uobjects- Disable/Reduce further with Significance Manager
Collision & Physics
By default meshes in your scenes will have both physics and collision enabled. This can be wasteful if you don’t use physics and especially if a lot of them are moving around. Player movement only requires ‘QueryOnly’ on objects and so it’s possible you are wasting CPU and memory on loading and maintaining physics bodies that remain unused.
- Unreal configured to just work out of the box
- “Collision Enabled” => Physics + Query
- Most things require just “QueryOnly”
- Disable Components that players can’t reach or interact with
- Profiling
stat physicsstat collisionobj list class=BodySetupshow CollisionPawnshow CollisionVisibility
Tip: Landscape may use lower collision MIPs.
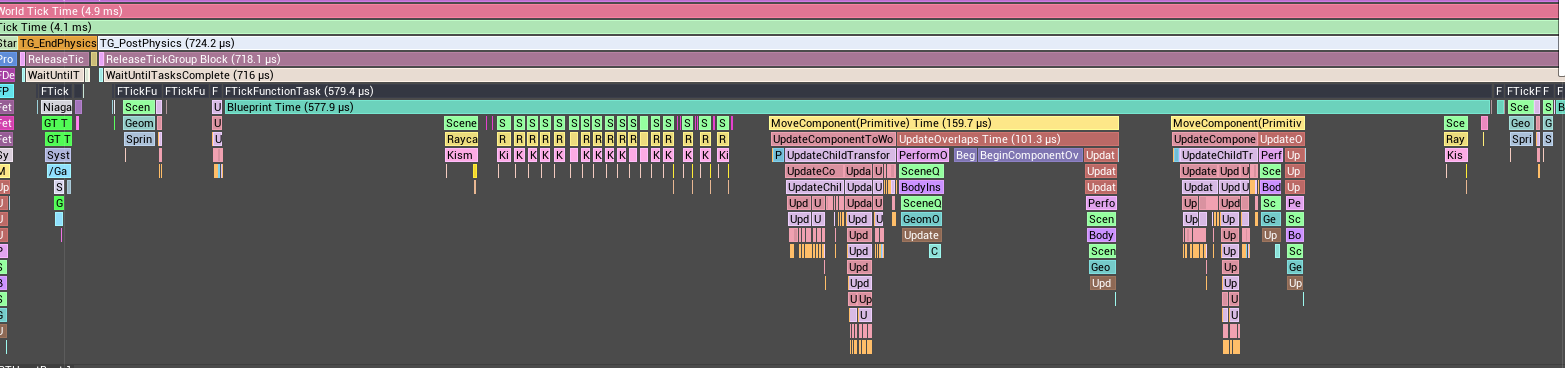
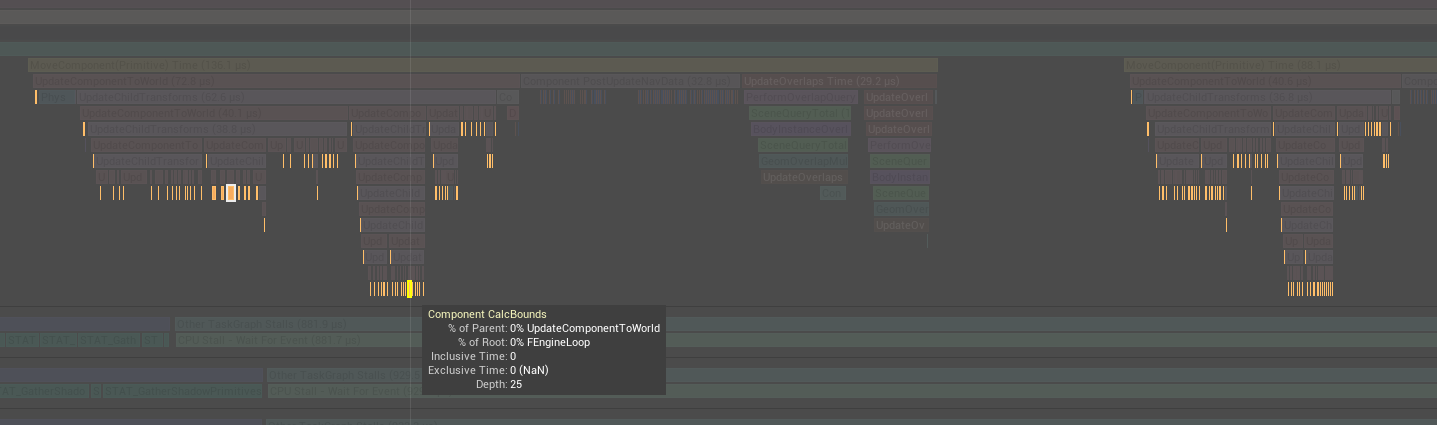
Moving SceneComponents
Moving game objects with a lot of SceneComponents is far from free. Especially if you use default settings. There are some easy optimizations to apply which can greatly reduce CPU cost.
- Move/Rotate only once per frame
- Disable Collision & GenerateOverlaps=False
- AutoManageAttachment
- Audio & Niagara
- Profiling
stat component
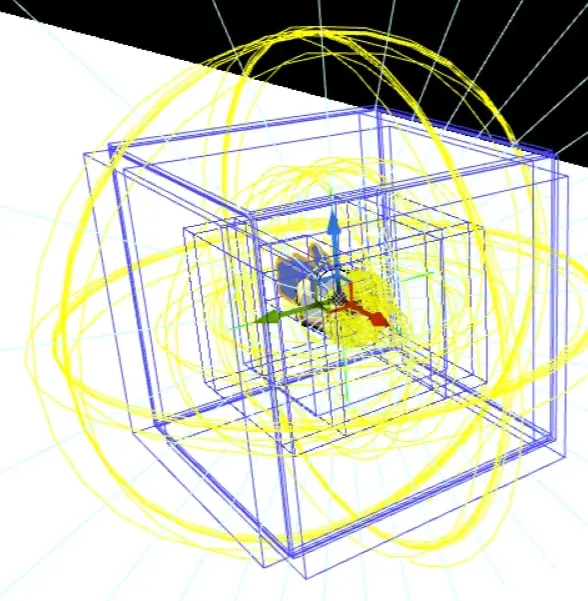
Component Bounds
While not expensive on a per-component basis, with tons of PrimitiveComponents in a single Blueprint this can add up. Be considerate when re-using the parent’s bounds as the child may be outside the bounds when animating the object which will cause render popping as the camera starts to look away.
UseAttachParentBound=True- Skips “CalcBounds”
show Boundsorshowflag.bounds 1
 |  |
Significance Manager
Significance Manager provides a bare-bones framework to calculate a ‘significance’ value for gameplay objects and scale down their features on the fly. You might reduce the tick rate on distant AI agents, or disable animation entirely until they get close enough. This system will be highly specific to your game and will be especially helpful for non-linear experiences where you can’t rely on trigger volumes to disable these gameplay objects.
Significance Manager is often only briefly mentioned but can be challenging to get started with. The implementation can be pretty straightforward depending on your needs, so it’s a worthwhile system to explore!
- Scale down fidelity based on game-specific logic
- Distance To
- Max number of objects in full fidelity (‘buckets’)
- Calculates ‘significance value’ to scale-down game objects
- Examples: NPCs, puzzle Actors, Vehicles, other Players
- Reduce/Cull:
- Tick rate
- Traces / Queries
- Animation updates (SKs)
- Audio/Particle playback or update rate
- Profiling
- ShowDebug Significance Manager
- sigman.filtering <name>
- stat significancemanager
- ShowDebug Significance Manager
Occlusion Culling
Occlusion Culling is often a costly part of your frame and something that may be difficult to tackle without knowing what’s adding this cost and the tools available to optimize. The easiest is to reduce the number of considered primitives. This is where level streaming, HLOD, and distance culling can be great help.
- Frustum Culling and Occlusion Queries
- GPU query results polled in next frame
- HOLD Can greatly reduce occlusion cost
- Profiling
r.visualizeoccludedprimitives 1stat initviews
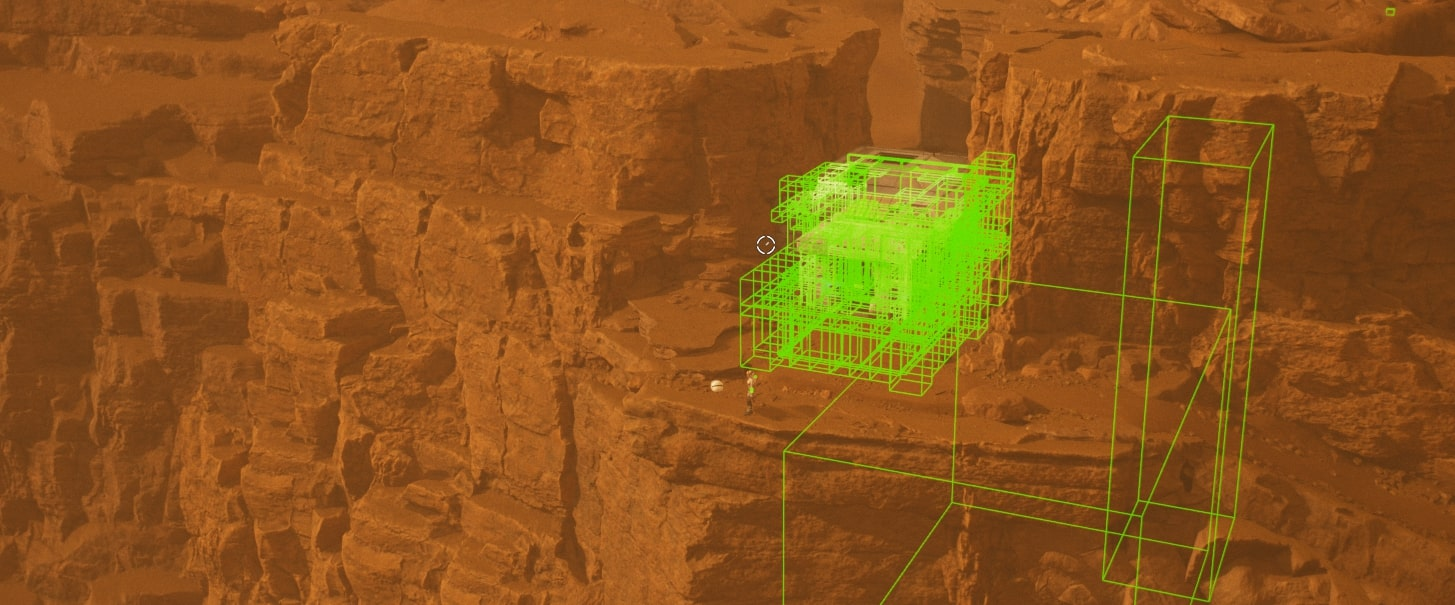
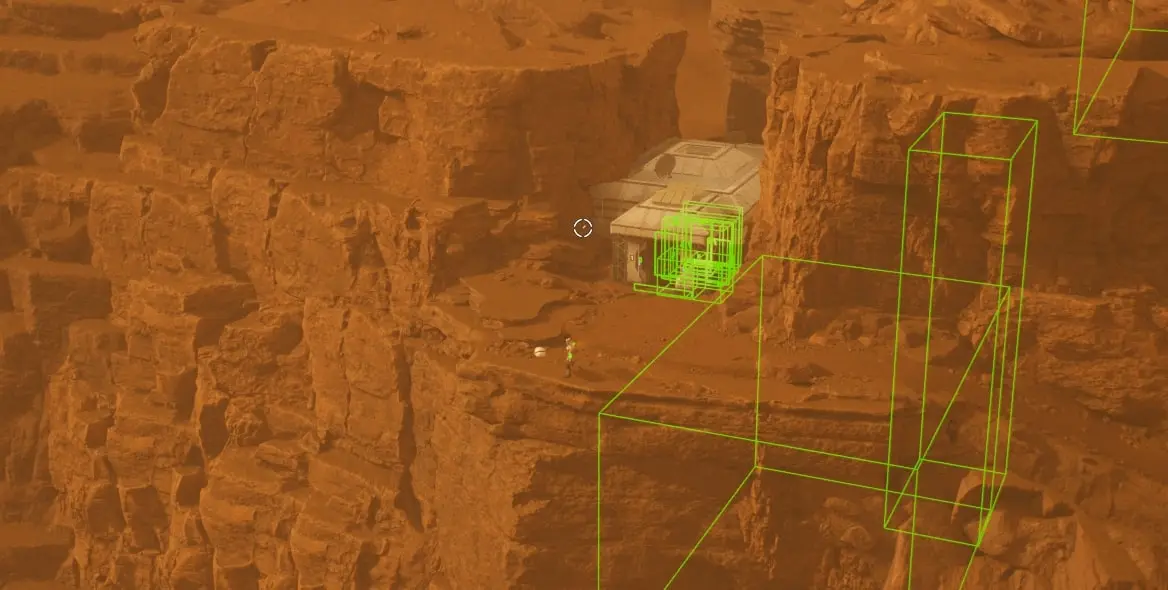
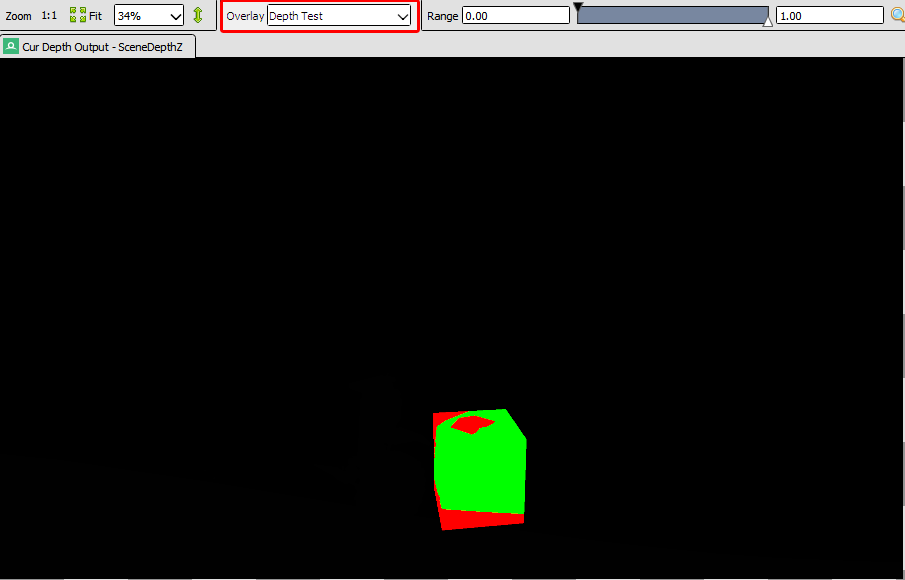
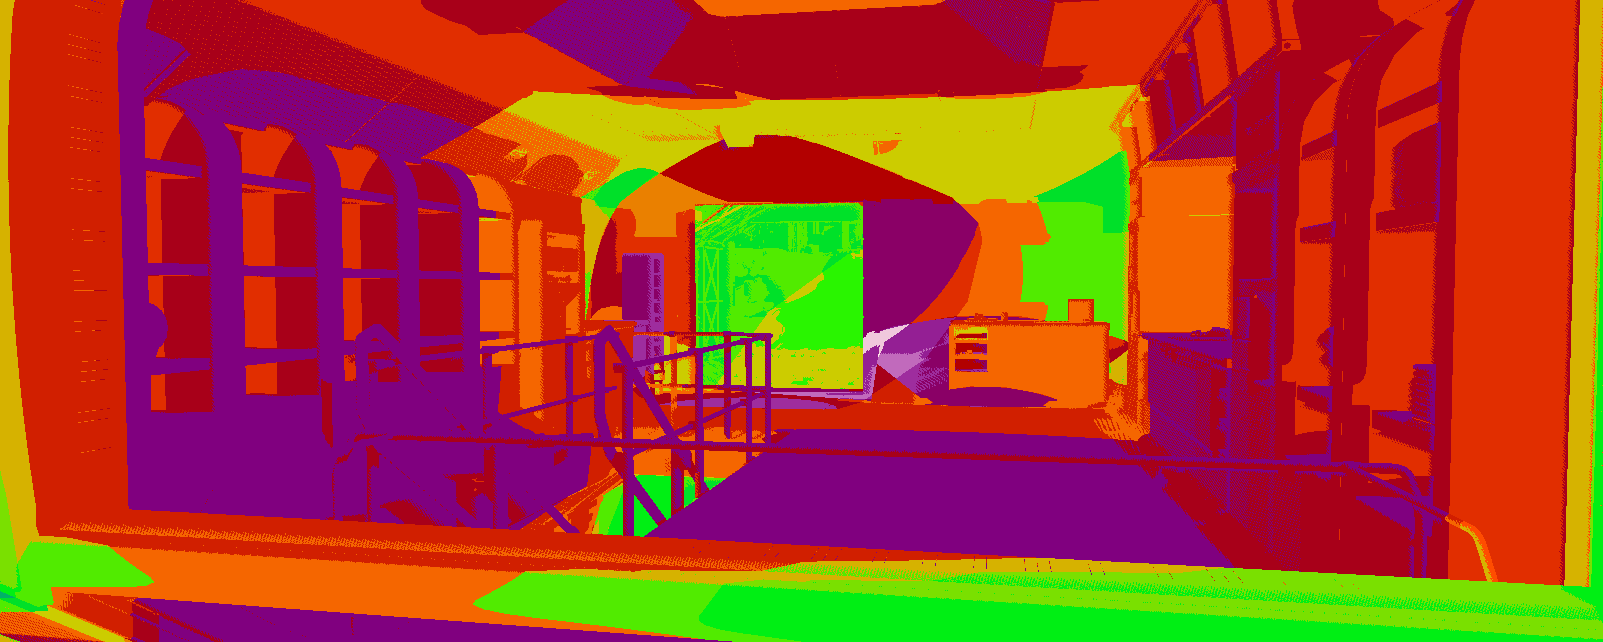
RenderDoc: Occlusion Query Results
RenderDoc is a fantastic tool to help dissect and understand how Unreal is rendering your frame. In this example, DepthTest is used to visualize the occlusion query result. You may find you are sending hundreds of queries with boxes of only a few pixels in size that had no chance of ever succeeding or the tiny mesh even being relevant to the frame once rendered.
DepthTestOverlay in RenderDoc- Easily find ‘wasteful’ queries on tiny/far objects
Distance Culling
Distance Culling is an effective way to reduce the cost of occlusion. Small props can be distance culled using a per-instance setting or using Distance Cull Volume to map an object Size with cull Distance. Objects culled this way don’t need GPU occlusion queries, which can significantly cut cost.
- PrimitiveComponent: Max/Min Draw Distance
- Light Cones, Fog Volumes, Blueprint Components
- Distance Cull Volume
- Maps object “Size” with “CullDistance”
- Reduce Occlusion Query cost
- Profiling
showflag.distanceculledprimitives 1stat initviews
Min/Max Draw Distance
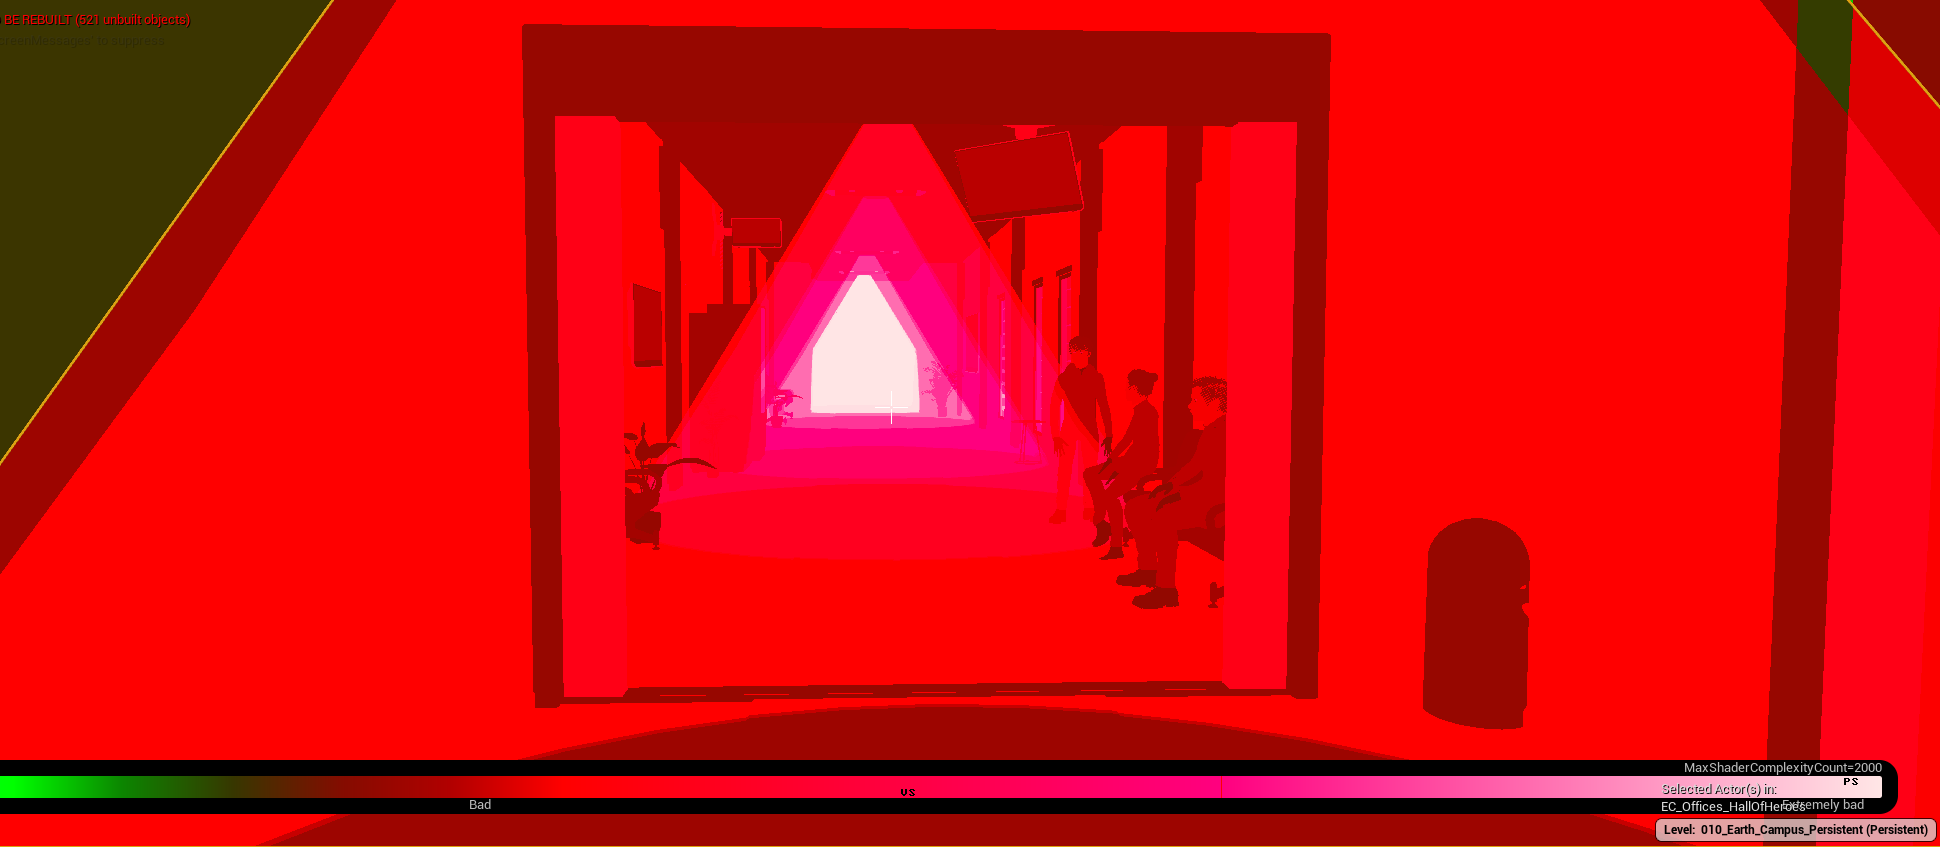
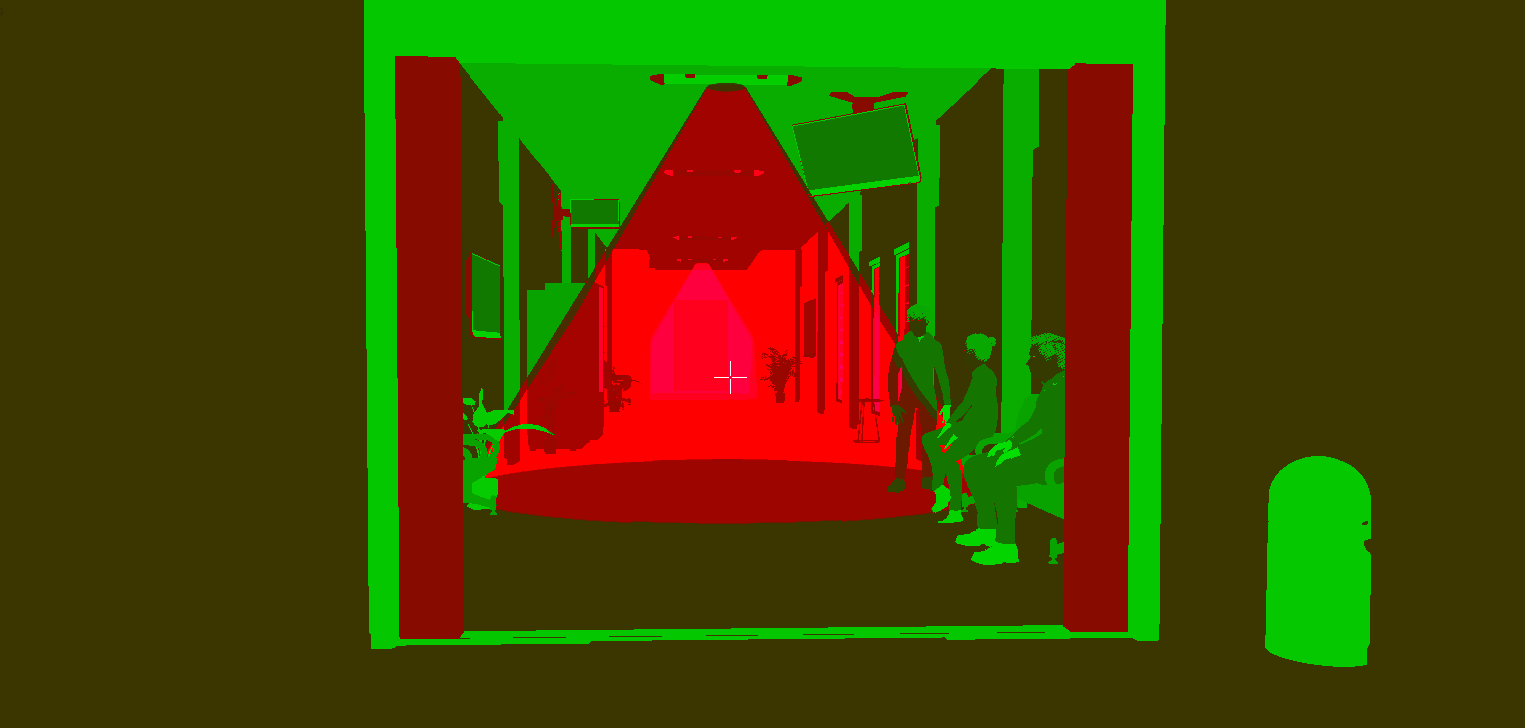
MinDrawDistance may be useful to cull up-close translucent surfaces that cause a lot of overdraw and don’t necessarily contribute a lot to your scene (eg. it might even fade out when near the camera in the material, this still requires the pixel to be evaluated).
- Example: Light Cones
- Vis: Shader Complexity
- Pixel Overdraw
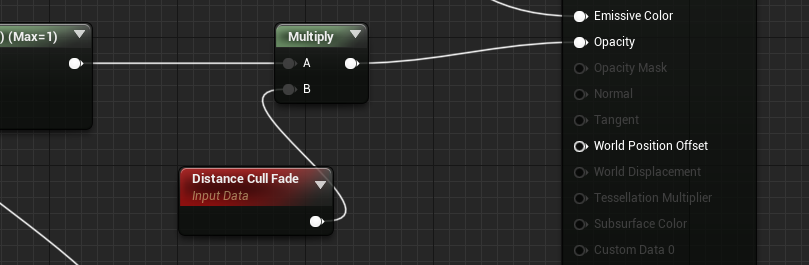
- DistanceCullFace
- Blends 0-1, 1-0
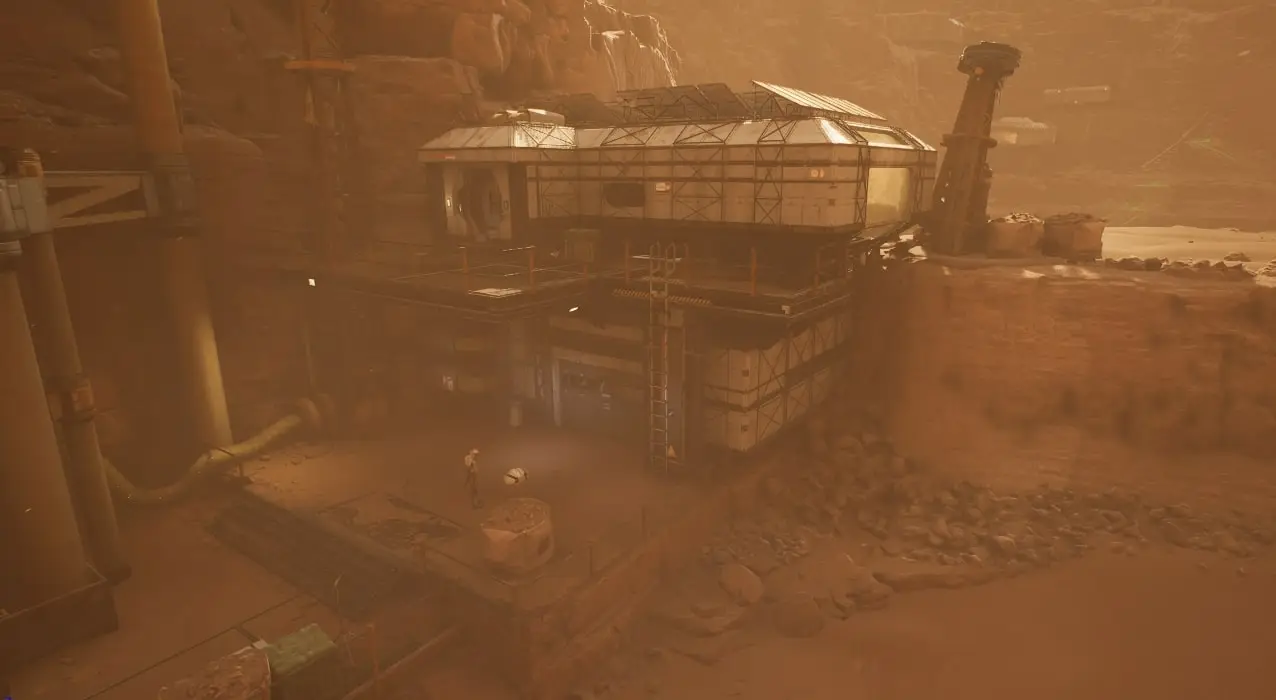
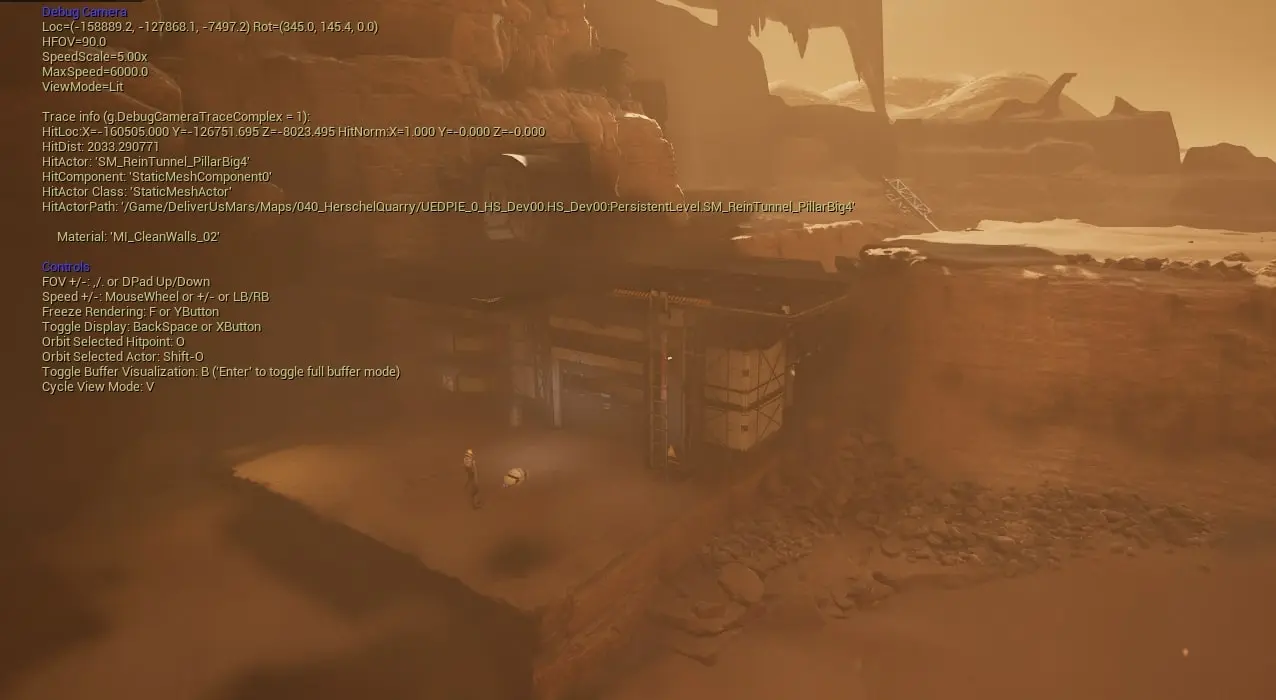
FreezeRendering
Freeze the occlusion culling to see whether your scene is properly occluded or if certain Actors are still rendered unexpected.
- ‘FreezeRendering’ + ; (semi-colon) to fly with DebugCamera
- Verify occlusion is working as expected
Light Culling (Stationary & Movable)
Lights can still add considerable cost to your render thread even if they aren’t contributing much or anything at all. Fading them out at range can help, make sure they don’t more or change unless they absolutely have to. Avoid overlapping too many stationary lights (Max 4) or one will be forced Movable, adding considerable cost to your frame.
- Automatic ScreenSize culling is not strict enough
- MinScreenRadiusForLights (0.03)
- Cull earlier case-by-case
- MaxDrawDistance
- MaxDistanceFadeRange
- Profiling
- Show -> LightComplexity (Alt + 7)
- Show -> StationaryLightOverlap
- ToggleLight <partialname>
Level Streaming
Level Streaming should be considered early in the level design to avoid headaches later. This includes splitting up level sections into sublevels and thinking about good moments to load/unload these levels.
Besides reducing the memory load potentially significantly, it can help occlusion cost a lot by keeping more levels hidden (or unloaded entirely) for as long as possible. bShouldBeVisible can be used in C++/Blueprint to hide the level. This keeps it in memory but out of consideration for occlusion etc.
- Streaming Volumes vs. Manual Load/Unload
- Camera Location based (caution: third person view and cinemetice shots)
- Cannot combine both on a specific sublevel, cam mix within the game
- Profiling
stat levelsLoadtimes.dumpreport(+loadtimes.reset)- Unreal Insight
- Look for level load & “GC” bookmarks
loadtime,filetrace channels
- Performance Impacts
- Initial level load time
- Occlusion cost
- Memory
- Options: Load, LoadNotVisible, LoadVisible
- Keep in memory while hiding to aid the renderer
- Consider streaming early in Level Design
- Splitting into multiple ULevels
- Line of sight, natural corridors and points of no return
Animation
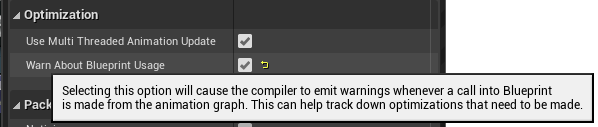
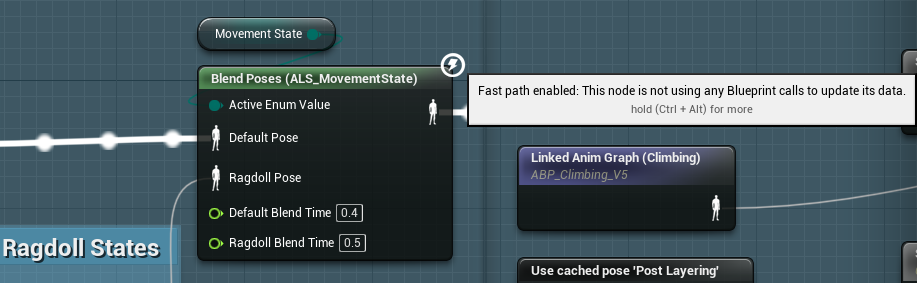
Fast Path
- Allow ‘Fast Path’ by moving Computations out of AnimGraph (into EventGraph)
- Use WarnAboutBlueprintUsage to get warnings in AnimGraph
- Profiling
- stat anim
Quick Wins
Skeletal Meshes add a chunky amount of processing to your CPU threads, there are some easy wins to look into when you have many SKs alive at a time, especially if they don’t always contribute to the frame.
- Update Rate Optimization (URO) for distant Skeletal Meshes
- VisibilityBasedAnimTickOption (per-class and config variable in DefaultEngine.ini)
- OnlyTickPoseWhenRendered
- AlwaysTickPoseAndRefreshBones
- …
- More Bools
- bRenderAsStatic
- bPauseAnims
- bNoSkeletonUpdate
Animation Compression Library (ACL)
Far greater decompression speeds can improve loading times as well. It works independently from Oodle.
- ACL Plugin (by Nicholas Frechette)
- Compression speed-up (from minutes to seconds, 56x faster)
- Decompression Speed (8.4x faster)
- Memory Size (cut in half across the game)
- Used in Fortnite and other AAA titles
- Eventually built-in UE5?
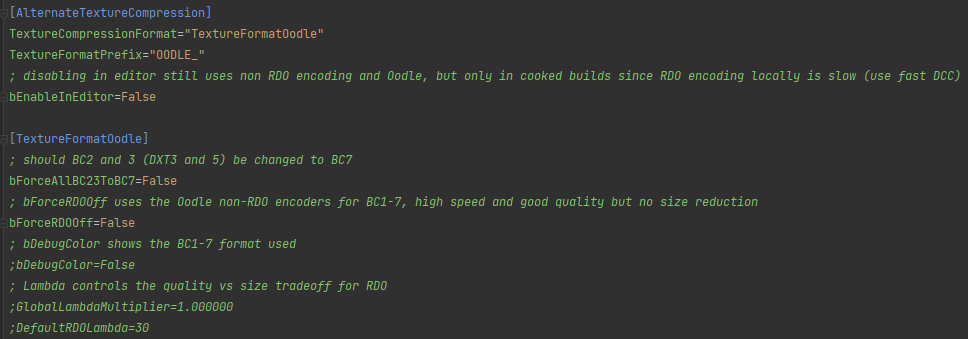
Oodle Data & Oodle Texture
Oodle has been providing incredible compression for years, and more recently ships with Unreal out of the box. It can greatly improve game packaged sizes and with faster decompression, it can improve load times as well.
- RDO (Rate Distortion Optimization) Compression
- Significant gains in compression compared to the default
- Takes longer to compress (off by default in-editor)
- RDO works with Oodle Data by “preparing” the texture data
SynthBenchmark
Scalability is a critical concept to allow your game to run on a wide range of devices. The hardware benchmark tool helps you evaluate the power of the machine the game is running on and apply a base layer of scalability (Low to Epic in the available categories such as Shadow Rendering, View Distance, etc.)
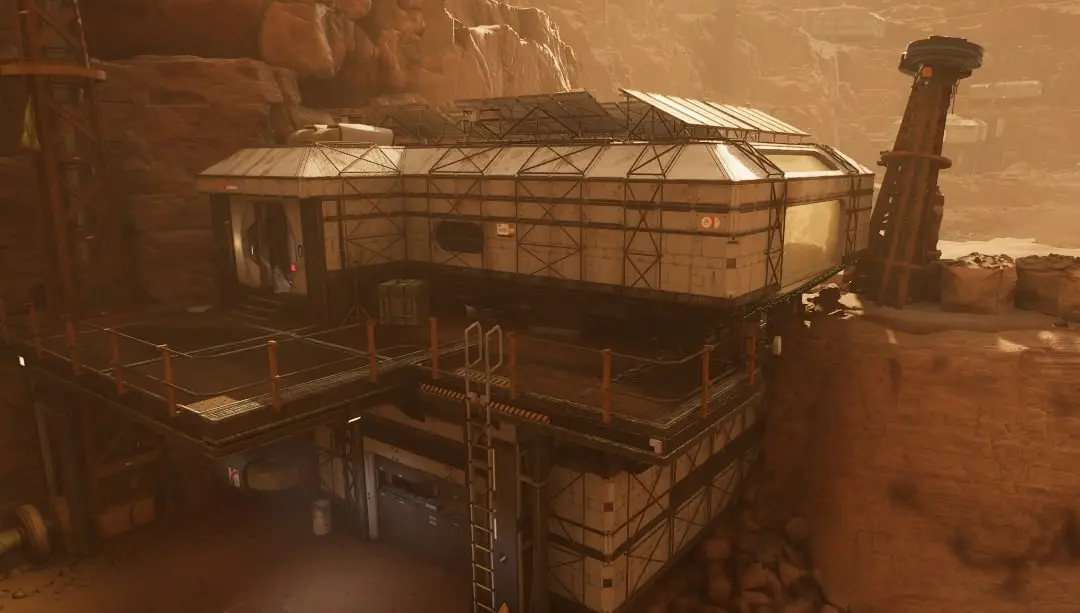
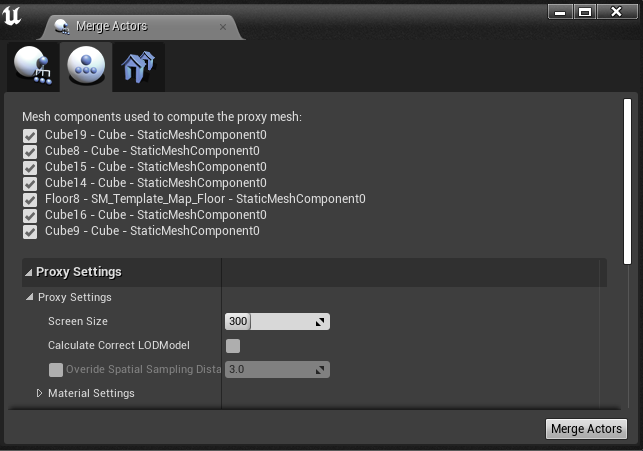
Shadow Proxies
Using Shadow Proxies is a manual process to reduce the often significant shadow rendering cost in your scene. You might have beautiful and modular buildings that cause a ton of draw calls and potentially millions of triangles for just shadow depth rendering. A big downside of this system is the manual and destructive workflow. With UE5’s geometry script, it may be only a few nodes away from generating simplified mesh proxies on the fly!
- Single low-poly silhouette mesh
- RenderMainPass=False
- Bespoke mesh or using built-in Mesh Tools
- ‘Merge Actors’ (Right-Click assets in level)
- UE5 Geometry Script
- Profiling
- ‘ShadowDepths’ in Insights &
- ProfileGPU + r.RHISetGPUCaptureOptions 1
 |  |
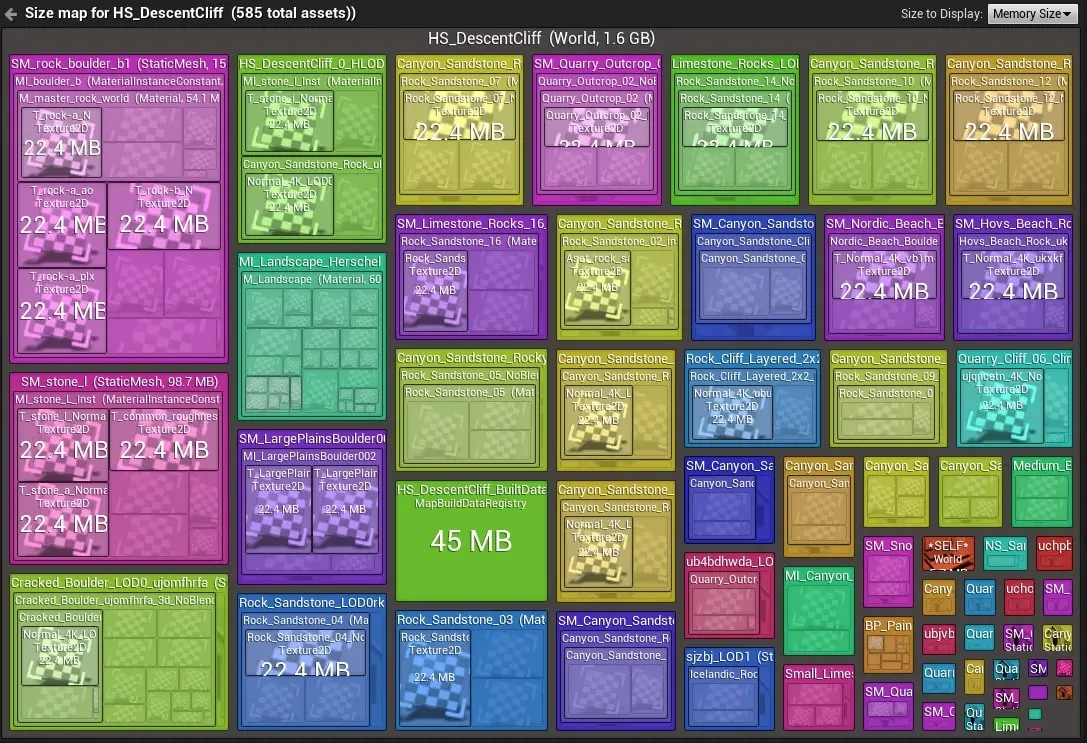
SizeMap (Disk & Memory)
SizeMap is a valuable tool to quickly find and address hard references in your content. This is an often hidden danger that can add considerable development cost and the end of your project once you’re struggling with memory and load times.
- Find unexpected references and bloated content
- Use on Blueprints and (sub) Levels early and often
Check out Mark Craig’s recent talk on the hidden danger of Asset Dependency Chains.
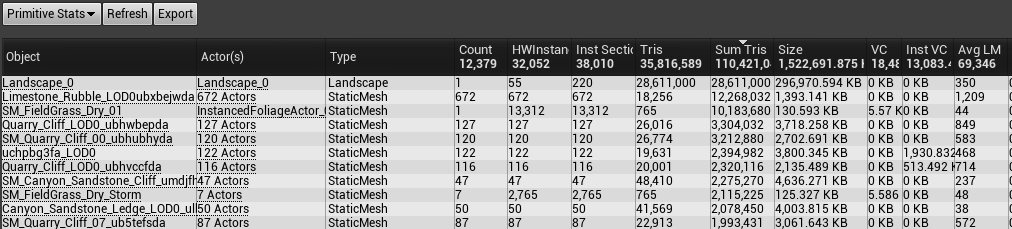
Statistics Window
I found myself often using this panel to investigate opportunities for memory and total map sizes. Especially Landscape assets will show up as huge bloated assets. Reducing collision complexity and deleting unseen Landscape Components can help a lot here. You may find certain asset variants used only once in the level, and can consider swapping these out to keep them out of memory and your load screen entirely!
- Stats on current level
- Primitives Stats
- Texture Stats
- Tip: Shift-click for secondary sort
- Sort ‘Count’ + ‘Tris’ or ‘Size’ (Find large assets used only once)
Useful Console Commands
- ToggleForceDefaultMaterial
- Will show significant changes to BasePass cost as everything can render with the same shader. You can use this to compare your scene and see how your shaders are affecting it.
- stat Dumphitches
- profiling hitches can be problematic, this is a first step in finding expensive function calls when a hitch does occur
- stat none (clear all categories on screen)
- r.ForceLODShadow X
- For low-end platforms, this can be one of those easy to do tricks to significantly cut down on triangles rendered for shadows. Make sure you have good LODs!
[ Content Source: https://www.tomlooman.com/unrealengine-optimization-talk/ ]